Discover the essential Key Performance Testing Metrics and learn why they play a crucial role in ensuring optimal software functionality and user satisfaction.
Key metrics to track in Performance Testing
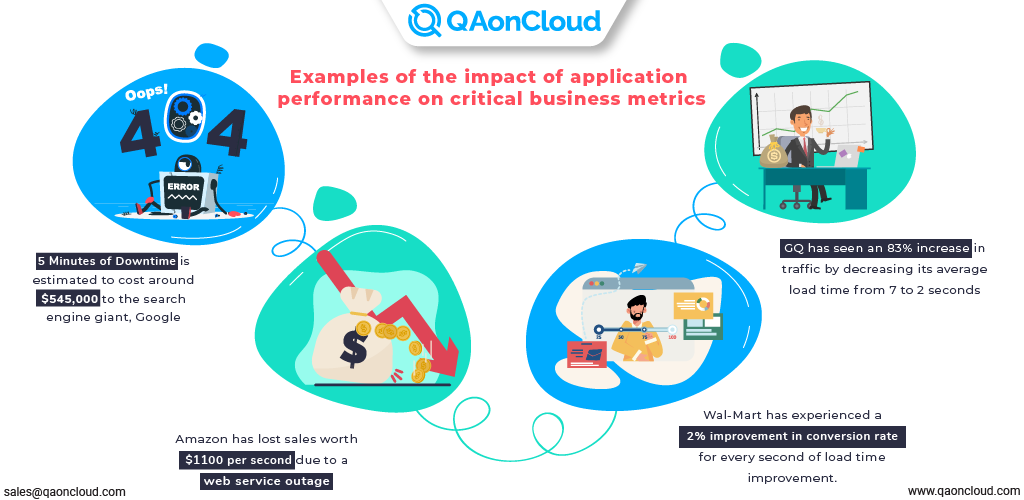
Did you know that over 59% of Fortune 500 companies experience a downtime of 1.6 hours every week? And it is costing your business a lot. Considering a Fortune 500 company with 10,000 employees pays $56 per hour, the cost to the company would be $896,000 weekly, translating to $46 million per year. In the age of tech-savvy customers, software applications are expected to perform every function accurately, and quickly, without any hiccups. Today, everything revolves around application performance.
Why Performance Testing Is Important?
Imagine you are browsing an e-commerce website, scrolling through the website, choosing a product, and then, nothing happens. Is it heavy traffic? Is it a low internet connection? Why is the product page not loading? And just like that, the eCommerce website lost a potential customer. Load time is one such factor of performance. Many other performance testing factors matter to best-in-class application performance. Before we get into the nitty-gritty of performance testing metrics, let’s get a quick overview of performance testing first.
What is Performance Testing?
Performance Testing ensures the quality of the software application by eliminating the possible performance bottlenecks. The outcome of performance testing helps in finding the gaps between the actual result and the expected environment. To achieve maximum success, it is important to define key criteria that measure and compare the actual output of the software application.
Here, key performance testing metrics come into play as they are the baseline for performance tests. The information obtained from the testing metrics helps in decreasing the error rate and provides excellent quality of the application. Monitoring the right parameters helps you understand the areas that require increased attention and find innovative ways to improve the application performance.
What Are Performance Testing Metrics?
Metric is a measurement gathered during the process of quality assurance. The performance metrics are used to calculate key parameters of performance and find out the weak areas of the application. In a nutshell, these metrics show the response of software to multiple user scenarios and handle the user flow in real-time. It helps in getting the clear output of the activities and finding out the areas of improvement.

Why Are Performance Testing Metrics Important?
Since performance testing plays a key role in the success of software applications, it is important to identify and evaluate the key metrics to achieve the best results. To achieve performance excellence, you need to define the milestones. Then, the parameters need to be measured that fall under the set milestones to estimate the output and compare it to the expected results. Therefore:
Metrics help in tracking the project progress.
They act as a baseline for the testing activities.
With testing metrics, the quality assurance team can define the issues and evaluate them to find the solution.
Tracking the metrics helps you to compare the test results and estimate the impact of code changes.
What Includes in Performance Testing Metrics?
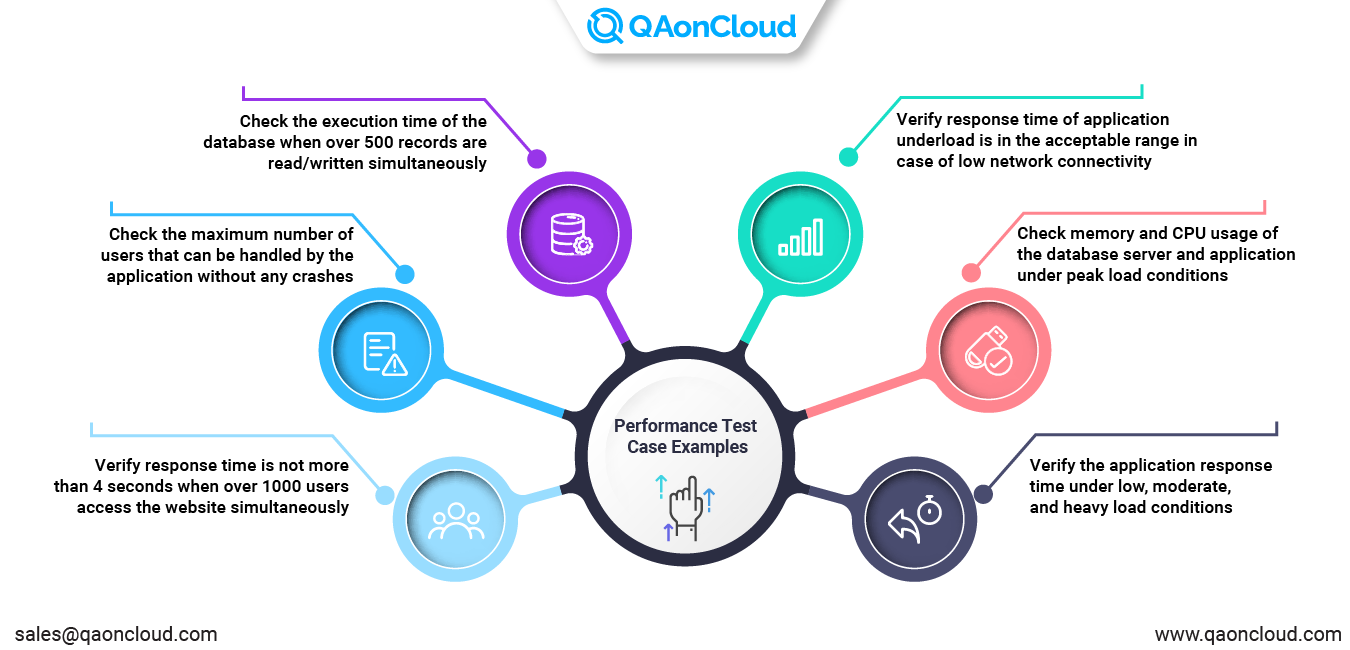
Now when you know that performance testing metrics are a necessity for a successful software application, the next question is – what metrics need to be tracked?
Well, it depends on the type of software, its core features, and business goals. So, here is the list of performance metrics with universal parameters you should track for every product.
Response time: The time that passes from the moment of server request until the last byte is received from the server is considered as response time. This performance testing metric is measured in kilobytes per second (KB/sec).
Requests per second: When the client application forms an HTTP request and sends it to a server, a response is generated and sent back to the client. The total consistent requests processed per second is a key performance metric – requests per second (RPS). These requests can be from multiple data sources including multimedia files, HTML pages, XML documents, JavaScript libraries, etc.
User transactions: The user transactions are a sequence of user actions via the interface of the software. By comparing the expected time with the transaction time (number of transactions per second), you can evaluate the load performance of the software application.
Virtual users per unit of time: This performance testing metric helps in finding out whether the software performance meets the expected requirements. It helps the QA team in estimating the average load and software behavior in different load conditions.
Error rate: This metric evaluates the ratio of valid to invalid answers over time. Usually, the error occurs when the load exceeds its capacity. And the results are calculated in percentage.
Wait time: This metric is also called average latency. It indicates how much time is passed from the moment a request is sent to the server until the first byte is received. Don’t confuse it with the response time – both consider different time frames.
Average load time: A study indicated that over 40% of users expect to abandon a website if it takes over 3 seconds to load. This performance testing metric is the evaluation of the average time taken to deliver the request. It is one of the most important parameters to ensure the best product quality.
Peak response time: This metric is similar to the average load time but the key difference is that the peak response time indicates the maximum time taken to fulfill a request. And it also shows that at least one of the components of software is problematic. That’s why this parameter is much more important than the average load time.
Concurrent users: This metric is also known as load size and indicates the number of active users at any point. It is one of the most widely used metrics to understand the software behavior under a specific number of virtual users. This performance testing metric is different from request per second as the quality assurance team does not generate consistent requests.
Transactions passed/failed: This metric expresses the percentage of passed or failed requests against the total conducted tests. It is as critical as the load time for users and considered as one of the most evident metrics to ensure product performance.
Throughput: Throughput shows the used bandwidth within the testing process. It indicates the maximum amount of data flowing through the network connection within a given amount of time. It is measured in KB/second.
CPU utilization: This metric evaluates the time taken by the central processing unit to process the request at a given time.
Memory utilization: This metric indicates the resources taken to process a request, in context to the physical memory on a specific device used for the tests.
Performance Testing Metrics: Parameters Monitored
Total user sessions: This metric indicates the intensity of traffic over time. For example, the number of user sessions per month, depending on the time frame of the product. This data can feature the transferred bytes and the number of page views.
Processor Usage – The time spent by the processor to execute the non-idle threads.
Disk time – The amount of time the disk is engaged in executing the request.
Bandwidth – It shows the usage of bits per second by the network interface.
Memory usage – The amount of physical memory used to process the requests.
Private bytes – The number of bytes allocated to a specific process that can’t be shared among other processes. It measures memory usage and leaks.
Page faults/second – The rate of processing the fault pages by the processor is evaluated. These page faults occur when the process requires code from elsewhere and retrieved from a disk.
CPU interrupts per second – It is the average number of hardware interruptions received and processed by the processor each second.
Disk queue length – It is the average number of requests lined up for the selected disk within a specific interval.
Network output queue length – It is the length of output packets lined up in packets. Anything above two means that bottlenecks need to be handled.
Network bytes total per second – It is the rate of sending and receiving the bytes on the application interface.
Response time – It is the total time from the request until the first character of the response is received.
Throughput – The rate of receiving the requests on a computer or network per second.
Connection pooling – The number of user requests met by the pooled connections. More requests met by connections in the pool lead to better performance.
Maximum active sessions – The total active number of sessions at once.
Hit ratio – This evaluates the number of SQL statements handled by the cached data instead of expensive operations of input and output. It helps in resolving bottlenecking issues.
Hits per second – The number of hits on the web server during every second of the load test.
Database locks – Locking of databases and tables that are monitored and tuned carefully.
Top waits – It determines the wait times that can be reduced when dealing with the retrieval of fast data from memory.
Thread counts – It measures the application health by the number of active threads.
Garbage collection – It evaluates the returning unused memory back to the system to increase the application efficiency.
Types of Performance Testing
The success of a website or application depends on its performance. This necessitates different types of performance testing to ensure best-in-class performance. The focus areas of performance testing include speed, scalability, and stability.
Read on to know the various types of testing to validate the application performance against performance testing metrics.
Load testing: This testing evaluates the performance of the system as the workload increases. The workload can be concurrent transactions or users. It consistently monitors the response time and system stability when the workload increases.
Stress testing: This is also called fatigue or stress testing. It is meant to measure the system performance outside of the parameters of normal working conditions. The application is tested with more transactions or users that can be handled. This testing helps in understanding the point where software can fail and how it can be recovered.
Spike testing: This type of testing evaluates the performance of software when the workload is increased repeatedly and quickly. As the name indicates, it measures the application performance when the workload is beyond usual expectations for a shorter time.
Endurance testing: Endurance testing is also known as soak testing. It evaluates the software performance with a normal workload over an extended time. It aims to check the system problems such as memory leaks.
Scalability testing: This testing process determines the handling of increased workloads. It can be determined by adding to the data volume or user load gradually while monitoring the performance of the system. Moreover, the workload may stay the same while resources like memory and CPUs are changed.
Volume testing: It is also known as flood testing as the test floods the data in the system. Volume testing determines the efficiency of software performance with a large amount of data.
How to Track Testing Metrics Correctly?
Tracking the metric just for the sake of testing is not a good idea. Metrics are not just the numbers to be written in the project reports.
Like any other process of quality assurance, the performance testing metrics should be capable of answering specific questions and test hypotheses based on the business goals. In this case, metrics can drive positive changes.
Below are the key principles to keep in mind if you want to use metrics for maximum benefits.
Specify the business objectives of the client to come up with the performance requirements.
Every feature should have a specific success metric – a single parameter or a range of parameters.
Metrics should be correlated with the value delivered to the user – stability, functionality, speed, etc.
Run multiple performance tests to track metrics, determine average indicators and get consistent findings.
The individual units of software are tested separately. Multiple checks on services and databases should be done before joining them into a single application.
Measure Key Performance Metrics Easily with QAonCloud
As you get started with the performance testing process, QAonCloud has all the tools and processes you need to ensure the flawless performance of your application. We help you to quickly get started and:
Save resources by automating the performance testing process.
Save time by building load tests from pre-configured templates in just a few clicks.
Understand the performance of the server by visualizing the effects with real-time monitoring.
Analyze the results by collecting advanced performance testing metrics and benchmarking them.
Reuse the existing test cases for increased efficiency and performance of the application.
By measuring performance testing metrics, you can avoid costly downtime during peak usage and ensure the best user experience. QAonCloud can make the whole process easier and better from start to finish.
Schedule a FREE DEMO with our performance engineers to walk through all the features and benefits of our testing solution. Get started with QAonCloud today.